Contents
Introduction
Overview
Learning Objectives
Home Dashboard
Navigation Menu
Status
Status Panel
Status Screenshot
Severity Indicators
Alerts
Alerts Panel
Statistics & Recent
Statistics
Recent Items
Complete
Summary
Knowledge Check
Complete
Powerfleet Unity Warehouse IoT Training
Home Dashboard
Overview
Module 1 · Powerfleet Unity Warehouse IoT
What You Will Learn
Status
Prioritized list of actionable events and system issues requiring attention
Recent Items
Quick-access list of the most recently viewed items in the system
Alerts
Real-time summary of system alerts you have subscribed to
Statistics
Summary data for your vehicles and operators
Navigation Tabs
Home
Visibility
People
Groups
Assets
Messaging
Reporting
Home Dashboard — Full View
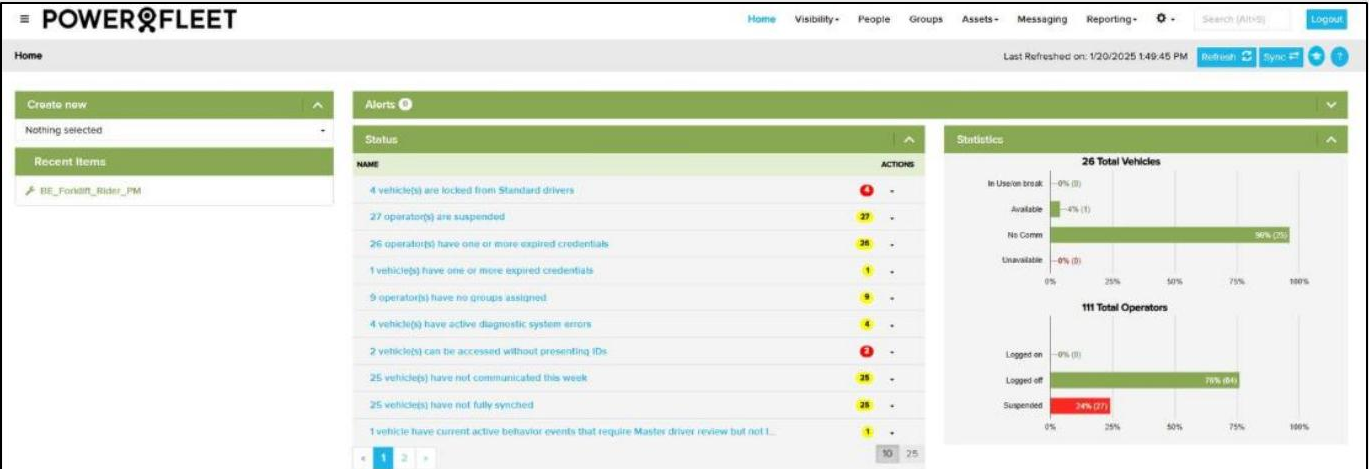
The Home Tab is your primary dashboard in Powerfleet Unity Warehouse IoT — showing all four panels at a glance.
Navigation bar across the top: Home · Visibility · People · Groups · Assets · Messaging · Reporting
Navigation Menu
Home
Dashboard overview — Status, Alerts, Statistics, and Recent Items
Visibility
Real-time map and location view of your fleet
People
Manage software users and forklift operators
Groups
Organize vehicles and operators into logical groups
Assets
View and manage individual vehicle records
Messaging
Send and review messages to operators in the field
Reporting
Run operational and compliance reports
Settings ⚙
System configuration, shifts, behavior profiles, and more
1
Status Panel
Understanding actionable events and severity indicators
Status Panel
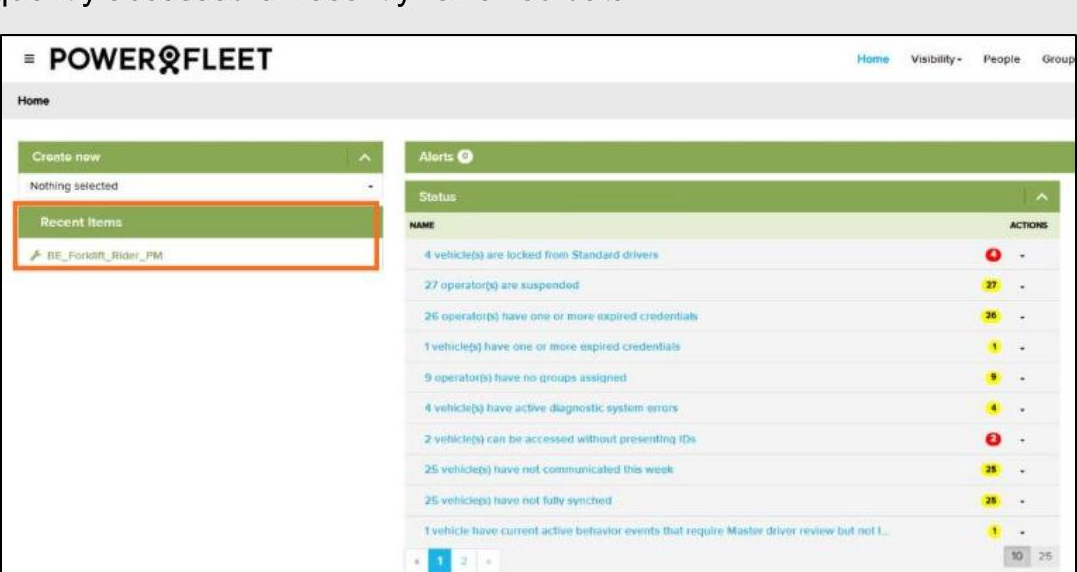
The Status panel displays a prioritized list of actionable events and system issues — the most critical always appear at the top.
What Status Items Show
- Event type and description
- Asset or operator name affected
- Count of affected items (colored badge)
- Items sorted by severity — critical first
- Click any item to open the full detail record
Red — Critical
Immediate action required. Prevents or severely impedes operations.
Yellow — Warning
Attention needed. Operations can continue but should be reviewed.
Green — Informational
No action required. Provided for awareness only.
Status Screenshot
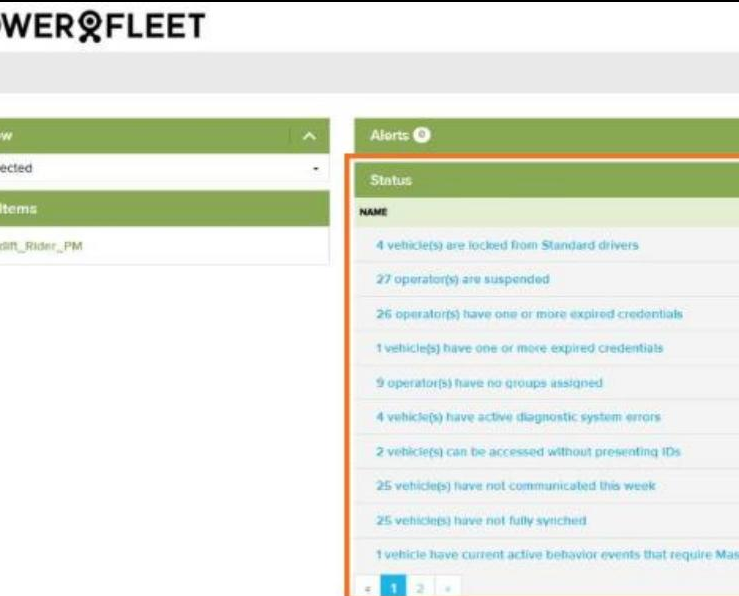
The orange border highlights the Status panel within the Home Tab.
Reading the Actions Column
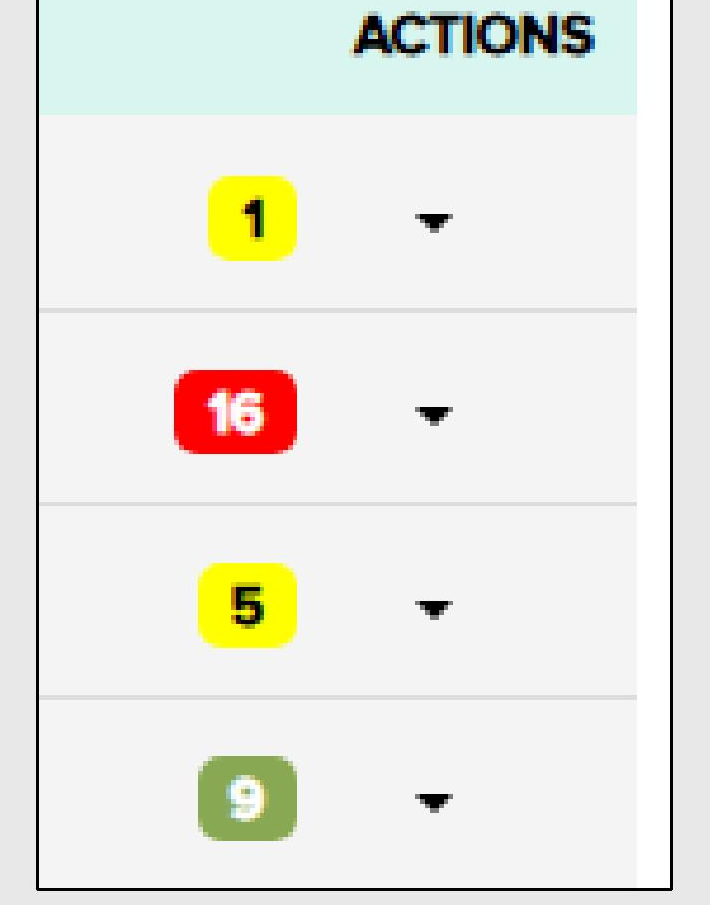
Each row in the Status panel shows a colored badge in the Actions column. The number inside tells you how many assets are affected by that condition.
Badge Colors
- Red badge — critical issue, immediate attention required
- Yellow badge — warning, review when possible
- Green badge — informational only, no action needed
- The number shows the total count of affected items
- Click the dropdown arrow (▾) next to any badge to see available actions
- Pagination at the bottom lets you scroll through all status items
A red badge with a high count signals fleet-wide issues that need immediate investigation.
Alerts Panel
The Alerts panel shows real-time notifications for events matching your personal subscriptions.
What Alerts Show
- Alert name and event type
- Number of occurrences since last viewed
- Timestamp of the most recent trigger
- Vehicle or operator associated with the alert
💡 Click any alert row to view the full event list and drill into individual occurrences.
Managing Alerts
- Alerts are user-specific — only your subscriptions appear here
- New alerts populate automatically when events are triggered
- Click an alert to open the associated event detail view
- Configure alert subscriptions in the Alerts settings section
⚠️ If the Alerts panel is empty, you may not have any active subscriptions configured.
Statistics Panel
The Statistics panel provides a high-level summary of vehicle and operator performance for the current period.
Vehicle Statistics
- Total active vehicles and status breakdown
- In Use / Available / No Comm / Unavailable counts
- Bar chart shows percentage distribution at a glance
Operator Statistics
- Total operators and logged-on/off breakdown
- Suspended operator count shown separately
- Helps spot understaffed shifts or compliance gaps
Use Statistics to quickly gauge fleet health before starting your shift review.
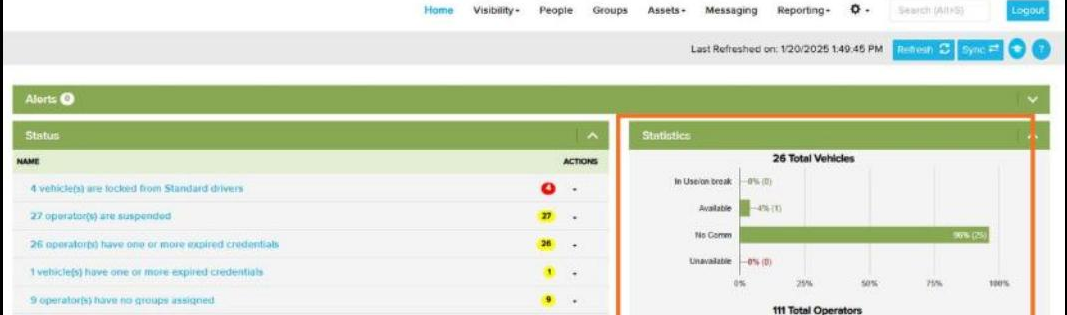
The orange border highlights the Statistics panel on the right side of the Home Tab.
Recent Items Panel
The Recent Items panel tracks the records you have most recently viewed, giving you one-click access to return to them.
How It Works
- Automatically updates each time you open a record
- Stores up to the last 10 accessed items
- Includes vehicles, operators, groups, and reports
- Persists across sessions — available on next login
- Click any item to navigate directly to that record
Recent Items is especially useful during incident review — quickly jump back to assets you were investigating.
The orange border highlights the Recent Items panel on the left side of the Home Tab.
Module Summary
You have reviewed all four key areas of the Home Tab dashboard.
Four Key Areas
- Status — prioritized list of actionable events and system issues
- Recent Items — most recently viewed items in the system
- Alerts — system alerts you have subscribed to
- Statistics — summary data for vehicles and operators
Navigation Tabs
- Home — this dashboard
- Visibility — real-time fleet map
- People — users & operators
- Groups — vehicle & operator groups
- Assets — individual vehicle records
- Messaging · Reporting · Settings ⚙
The Home Tab refreshes automatically. Use the Refresh button top-right to force an update.
Knowledge Check
Review these key points before completing the module.
Quick Review
- A red badge in the Status panel means a critical issue — immediate action is required.
- The Alerts panel only shows alerts you are personally subscribed to.
- The Statistics panel shows vehicle status breakdown and operator counts.
- Recent Items stores up to 10 records and persists across logins.
- Use the top navigation bar to move between system modules: Home, Visibility, People, Groups, Assets, Messaging, Reporting.
- Click any Status item, Alert, or Recent Item to navigate directly to its detail record.
✅ When you're ready, click Next to complete this module and record your progress.
✅
Module 1 — Home Dashboard
is now complete.
Your progress has been saved. You may close this window or return to the course menu.